CANtrace Help
A powerful CAN bus analyser software and diagnostic tool
The Data tab displays the run time value of the signals (from an associated database) received from the connected/monitored CAN networks. The value can be displayed in many formats, e.g. Physical which is a human-readable format.
The figure and table below explain the user interface of the Data tab. By right-clicking on the window or selecting Data from the top menu, you will find three submenu items. Submenu item Clear Values will clear the current values of the signal. Submenu item Configure Signals will open the form for you to add/remove the signals in the data window. Submenu item Font allows selecting between two different font sizes: Normal and Large. The current selection is remembered when CANtrace is closed.
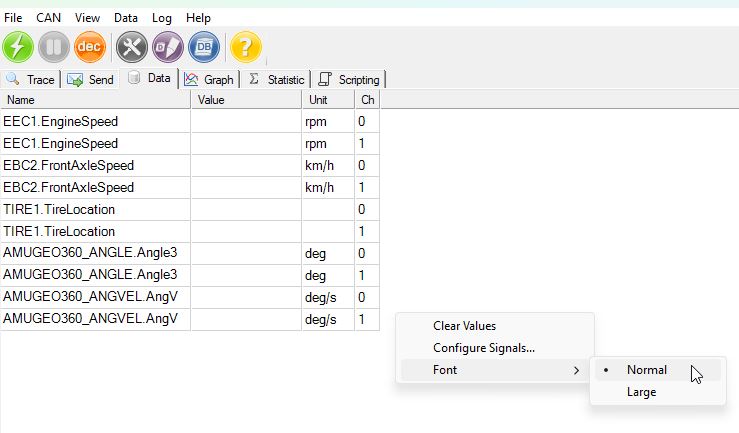
Figure 10.6 Signals view in the Data tab
Table 10.3 Data window column description
| Column Name | Column Description |
| Name | By default, the “Name” is set to the Signal name, but it can be changed in the “Name” field within the “Configure Signals” dialog. |
| Physical Value | To determine the signal value, the system first checks if a symbolic value exists in the signal’s value table. If a symbolic value is found, that value is used. If no symbolic value is available for the current signal value, the corresponding physical value is displayed instead. If a unit is available, it will be included with the physical value. |
| Raw value | The configured signal’s current raw value is shown in the application’s number format setting, either Hexadecimal or Decimal. |
| Channel | The software channel that the message containing this signal arrived on. |
Before adding a signal to the Data tab, the user needs to add a database first. Click here to see how to add a database.
To add, remove or configure signals, just right click the data window and choose Configure Signals from the menu. The Configure Signals window will appear, as shown below.
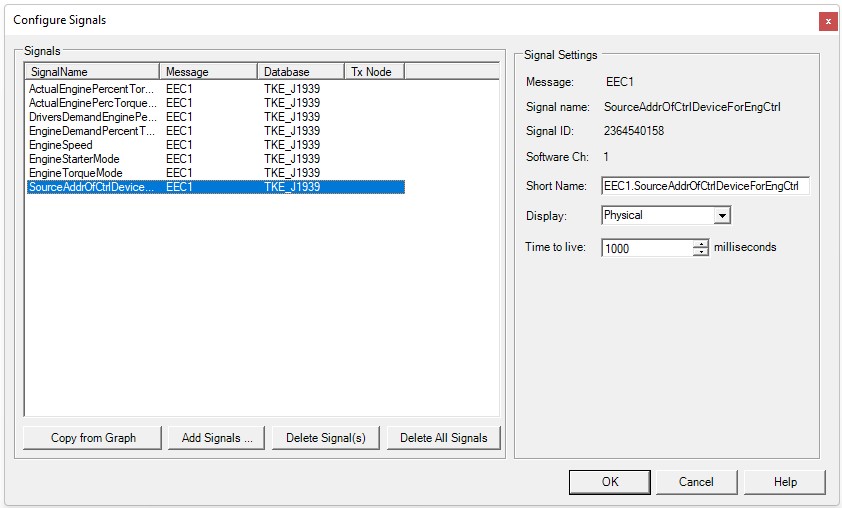
Figure 10.7 Configure Signals Dialog
Each added signal has its own configuration. When a signal is selected, its information from the database will be displayed on the right side of the window.
Signal Name: The original name of the signal as defined in the database.
Message Name: Shows the name of the parent message associated with the selected signal in the database.
Database: The name of the database of the signal.
Source Node: Indicates the name of the sourcenode for the signal.
Message Identifier: Message identifier for the signals message.
Channel: The software channel in CANtrace to which this database is assigned to.
Table 10.4 Configure Signals Form Description
| Name | Description |
| Add… | Add signals from the associated database |
| Add from graph… | Add the configured signals from the graph window if there are any |
| Delete | Delete the chosen signals |
| Delete all | Delete all the signals in the data window |
| Name | Signal name that is editable. You can define your own name of the signal that will be shown in the data window Name column, e.g. if the signal name is EngineSpeed, you can define rpm as the name. NOTE! Doesn’t change database This doesn’t change the original associated database file, it only changes the name shown on data window . |
| Data validity time: | Determines how long a signal value is displayed in the data view after the signal is no longer present on the CAN bus. |
Buttons:
OK – Saves and applies the configuration and closes the dialogue
Cancel – Discards the configuration and closes the dialogue
Help – Opens the Data Window section in the help document

TK Engineering Oy
Hovioikeudenpuistikko 13 as 3
65100 Vaasa, Finland
Kauppakatu 3 B
33200 Tampere, Finland
info@tke.fi
Phone: +358 6 357 6300
