CANtrace Help
A powerful CAN bus analyser software and diagnostic tool
This tab displays a graphical representation of the chosen signals. The graph tab contains two types of views: single graph view and multi graph view.
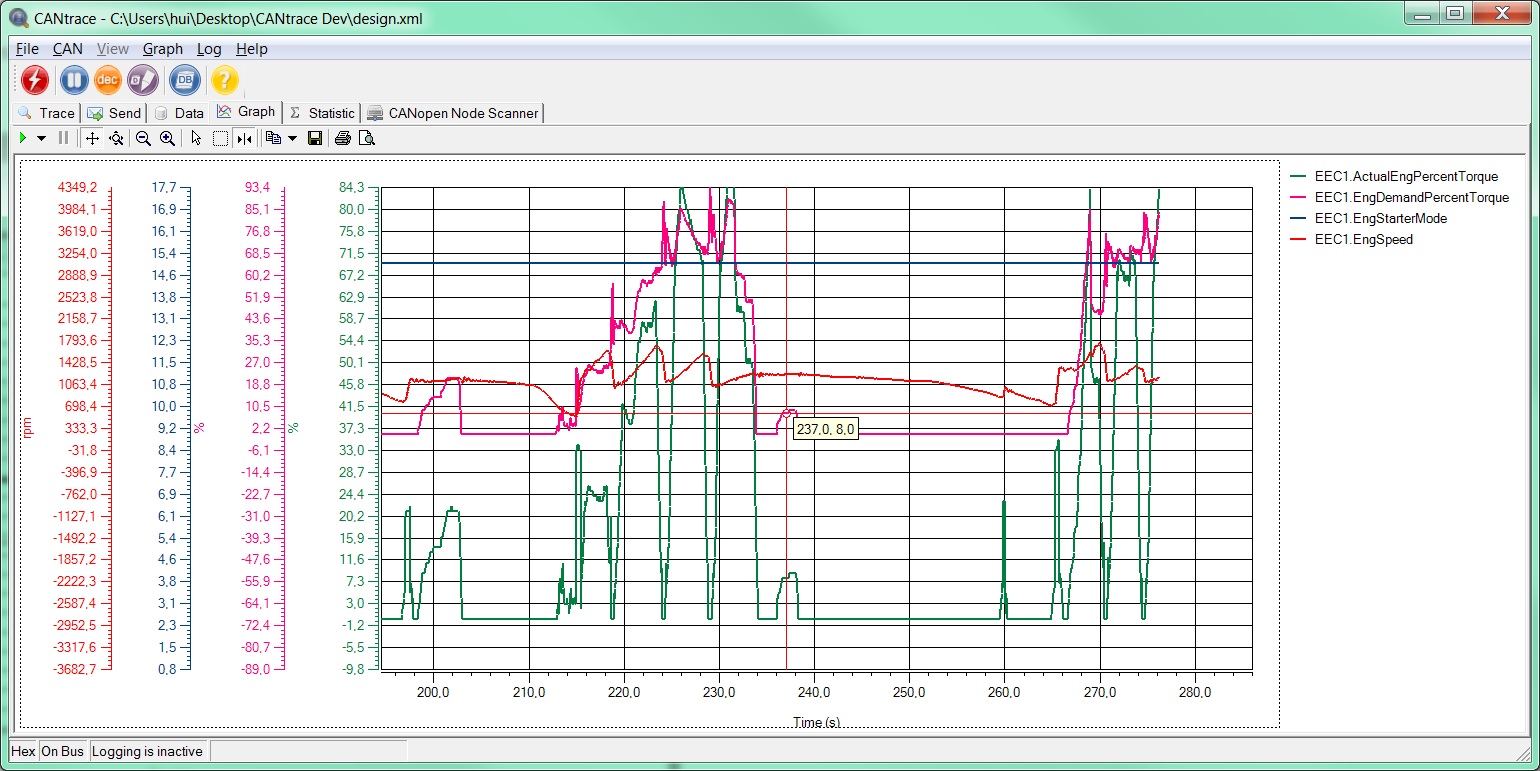
Figure 10.8 Graph view
Before adding a signal to the Graph tab, the user needs to add a database. Click here to see how to add a database.
To add, remove or configure signals, just right click the Graph window and choose Configure Signals from the menu. The below dialog box will appear.
On the top left of the dialog user can see how many signals they have configured.
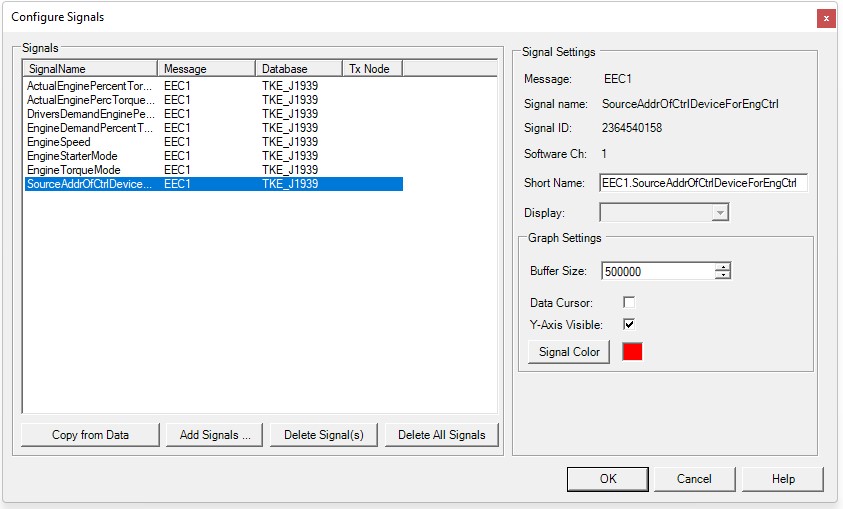
Figure 10.9 Configure Signals Dialog
Each added signal has its own configuration. When a signal is selected, its information from the database will be displayed on the right side of the window.
Table 10.5 Configure Signals Form Description
| Name | Description |
| Add… | Add signals from the associated database |
| Add from data… | Add the configured signals from the Data tab if there are any. |
| Delete | Delete the chosen signals. |
| Delete All | Delete all signals on the graph window. |
| Legend Name: | Signal name that is editable. You can define your own name of the signal that will be shown graphically. E.g. the signal name is EngSpeed, you can define rpm as the short name. NOTE! Doesn’t change database This doesn’t change the original associated database file, it only changes the name shown on graph window |
| Signal Color: | Configure the color shown for the signal in the graph. |
| Minimum value: | Configure the minimum value for the signal’s y-axis in the graph. |
| Pull minimum and maximum values from the database for the signal. | |
| Maximum value: | Configure the maximum value for the signal’s y-axis in the graph. |
| Visible in single graph view: | Configure to show/hide the selected signal in single graph view. To display the signal, open Configure Signals dialog and check the box or enable signal from the Legend. |
| Visible in multi graph view: | Configure to show/hide the selected signal in multi graph view. To display the signal, open Configure Signals dialog and check the box or enable signal from the Legend. |
| Y-axis Visible: | Configure to show/hide the y-axis for the selected signal in single graph view. To display the y-axis again, open Configure Signals dialog and check the box. |
| Y-axis drag and zoom enabled: | Configure to enable/disable drag and zoom in the single graph view. |
Buttons:
OK – Saves and applies the configuration and closes the dialogue
Cancel – Discards the configuration and closes the dialogue
Help – Opens the Graph Window section in the help document
Figure 10.10 Graph toolbar
Table 10.6 Graph icon
| Icon | Description |
| Resumes all tracking on all axes | |
| Pauses tracking on all axes. The graph window will be paused while the drawing continues. | |
| Axes scrolling, click on the axis and move upwards/downwards to move the location of the signal’s graph | |
| Axes zoom, click on the axis and move upwards/downwards to zoom in/out the signal’s y-axis. By clicking on the graph, you can zoom in/out the whole graph vertically (x-axis) and horizontally (y-axis) | |
| Zoom-out, zoom out the selected y-axis or the whole graph | |
| Zoom-in, zoom in the selected y-axis or the whole graph | |
| Select | |
| Zoom-box, zoom in the selected area | |
| Data-cursor, enables/disables data-cursor feature for the configured signals (Data cursor is checked while configuring the signals) | |
| Copy to clipboard, copy the whole graph or copy only the x-axis and y-axis values of all the configured signals to clicpboard | |
| Save the graph | |
| Print preview |
By using the mouse, it is possible to zoom, both vertically and horizontally. Click on the axis you want to zoom and hold down the Ctrl key. Use the mouse for actual zooming. If you only want to move on the axes or move the signals just grab the axis and then scroll or move your mouse.
Zooming in or out on the y-axis changes the precision (decimal amount) displayed on the y-axis. Decimals are added or decreased to fit the y-axis values. Still each y-axis has a maximum precision taken from the associated database that can’t be exceeded.
Once you have enabled the Data Cursor in the Legend for wanted signals, you will be able to see the data cursor for these signals. As seen in the figure below, you can configure the display mode for the selected cursor by right-clicking on the signal in the legend.
You can also change the location of the value on the cursor by dragging it to the location you want (left click mouse and hold to drag) in single graph view. In multi graph view the cursors nor the hint-boxes cannot be moved.
Data cursor values are taken from each respective axis with the same precision (decimal amount).
Table 10.7 Data Cursor Description
| Name | Description |
| Show/Hide Cursor | To show/hide the chosen cursor. The cursor will be shown again if you disable and enable Data Cursor button on the toolbar |
| Cursor Style |
To change the display style of the data cursor. You can configure to display only x-axis value or y-axis value or both values and you can measure period, peak to peak and frequency of the signal |
| Show/hide all cursors | To show/hide all previously used data cursors. |
| Reset all cursors | To reset all of the datacursors to initial position and type, and hiding them all. |
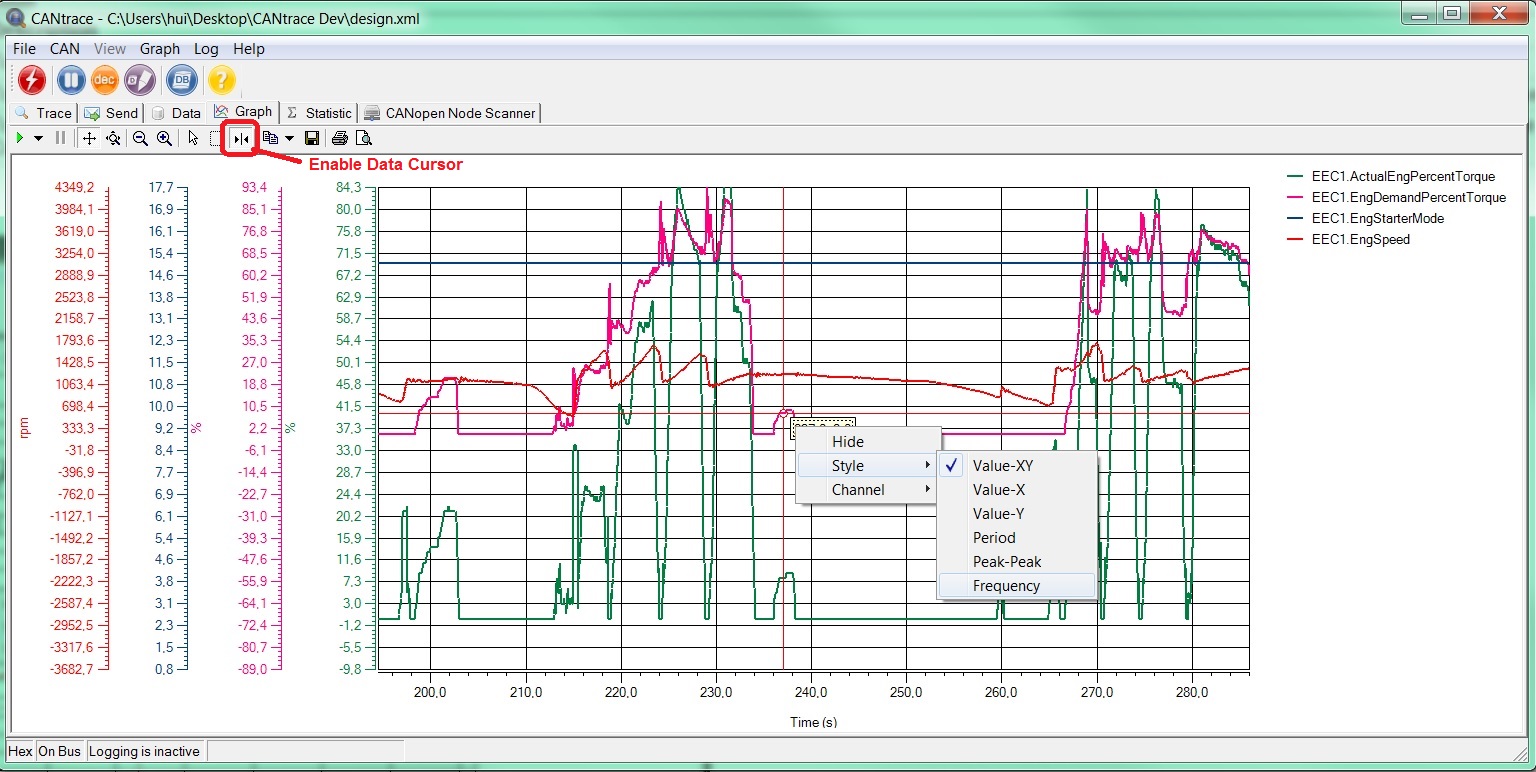
Figure 10.11 Data Cursor

TK Engineering Oy
Hovioikeudenpuistikko 13 as 3
65100 Vaasa, Finland
Kauppakatu 3 B
33200 Tampere, Finland
info@tke.fi
Phone: +358 6 357 6300
