Getting Started with CANtrace
A powerful CAN bus analyser software and diagnostic tool
After you have downloaded the zip package from our website, you need to following below procedures to install CANtrace.
After you have installed CANtrace on your PC, you may need a demo license for evaluation. Below steps show you how to get the serial number used in CANtrace for your CAN hardware.
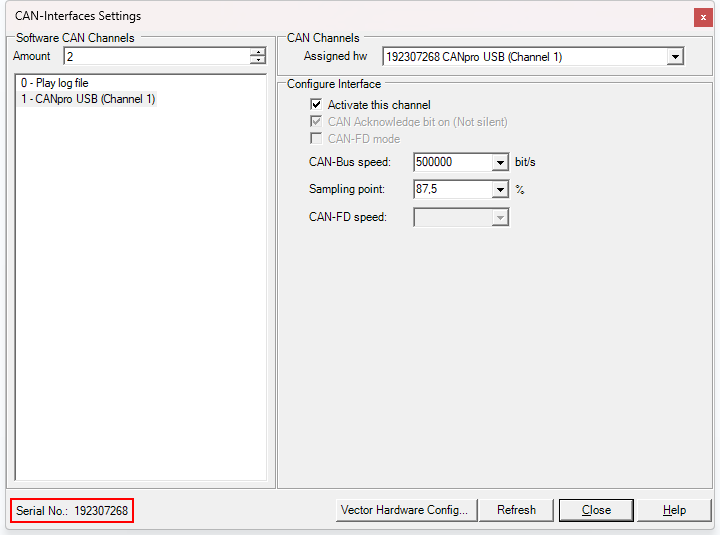
If you are using Peak CAN hardware, open the CAN->Settings… window, and find the Serial nr: that is similar to 6A5FEBF2290D21BFBFF and send this number to us for generating demo license. This is because CANtrace is using the PC’s serial number for Peak CAN hardware.
If you are using Vector hardware with CANtrace for the first time, you need to assign CANtrace to one or more of the CAN interface channels.
Make sure you have the Vector driver installed on your PC.
Select menu CAN→Settings… to open the CAN-Interfaces Settings window. Then click the Vector Hardware Config… button to open the Vector Hardware Config tool.
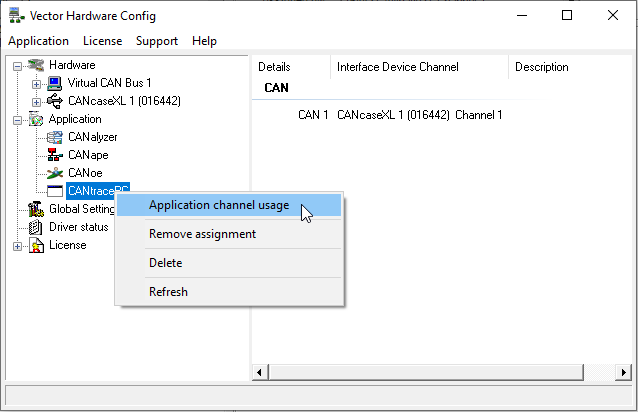
In the tree-view on the left, click open Application. Right-click on CANtracePC and select Application channel usage.
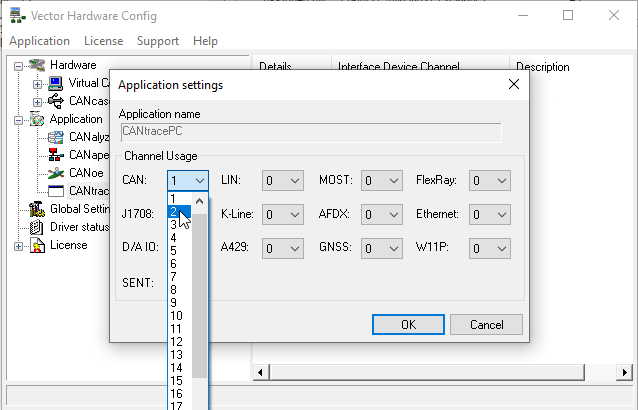
Select the number of channels of the Vector CAN interface to assign to CANtrace and click OK.
Right-click on the first listed “CANpiggy” entry (representing channel 1 on the CAN interface) and select CANtracePC→CAN 1. See the screenshot below.
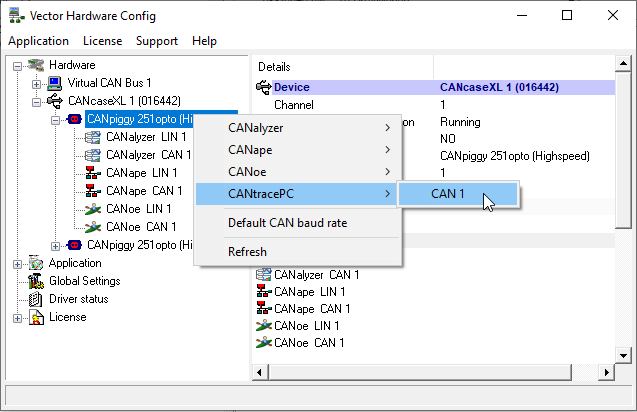
To assign CANtrace to channel 2, right-click on the second CANpiggy entry and select CANtracePC→CAN 2.
After assigning CANtrace to one or more Vector channels, close the tool. Click the Refresh button. The configured Vector hardware channels should now be available in the Assigned hw drop-down box.
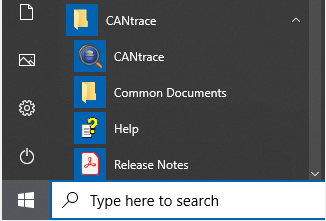
The procedure to do this can also be found in the CANtrace Help document, in section Vector Settings. A shortcut to the Help document can be found from the start menu, in the CANtrace folder.
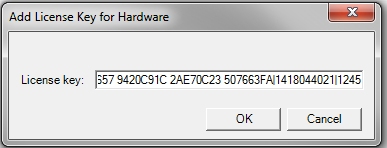
After you have received the license from us, you need to import the license to CANtrace.
After you have imported the license to CANtrace, you can start using CANtrace with your CAN hardware.
Use the following steps to decode and encode signal data automatically using a database (DBC) file.
This is a screenshot of J1939 signals when decoded in the Trace View.
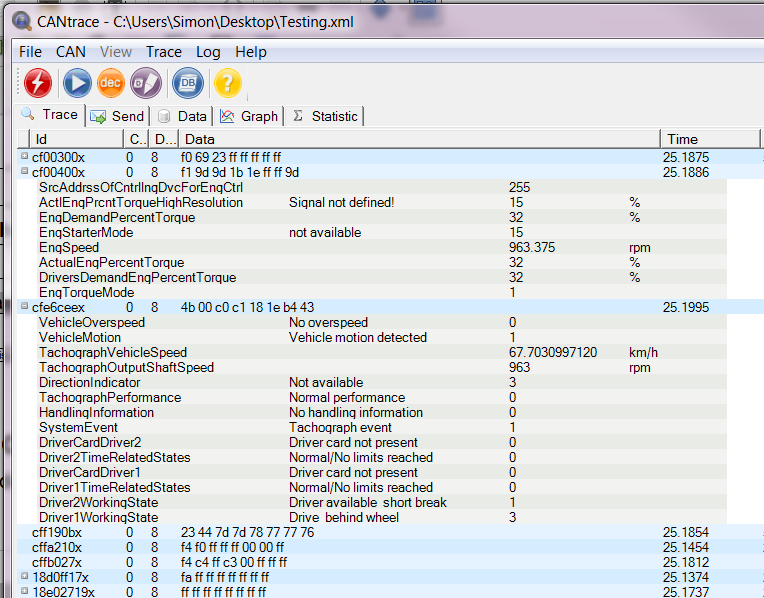
The blue lines are the raw CAN messages with ID and Data. The gray lines are the interpretation of the contents of the messages.
In this case the speed of the truck, as reported by the tachograph, can be seen in km/h and the engine speed in RPM is reported by the engine controller
While the Trace View shows all available CAN data, the Graph View only shows the signals that you add though the configuration dialogue.
In this case two signals have been added to the project: Tachograph Vehicle Speed and Engine Speed, and signals were plotted using two different colours to make the graph easy to read.
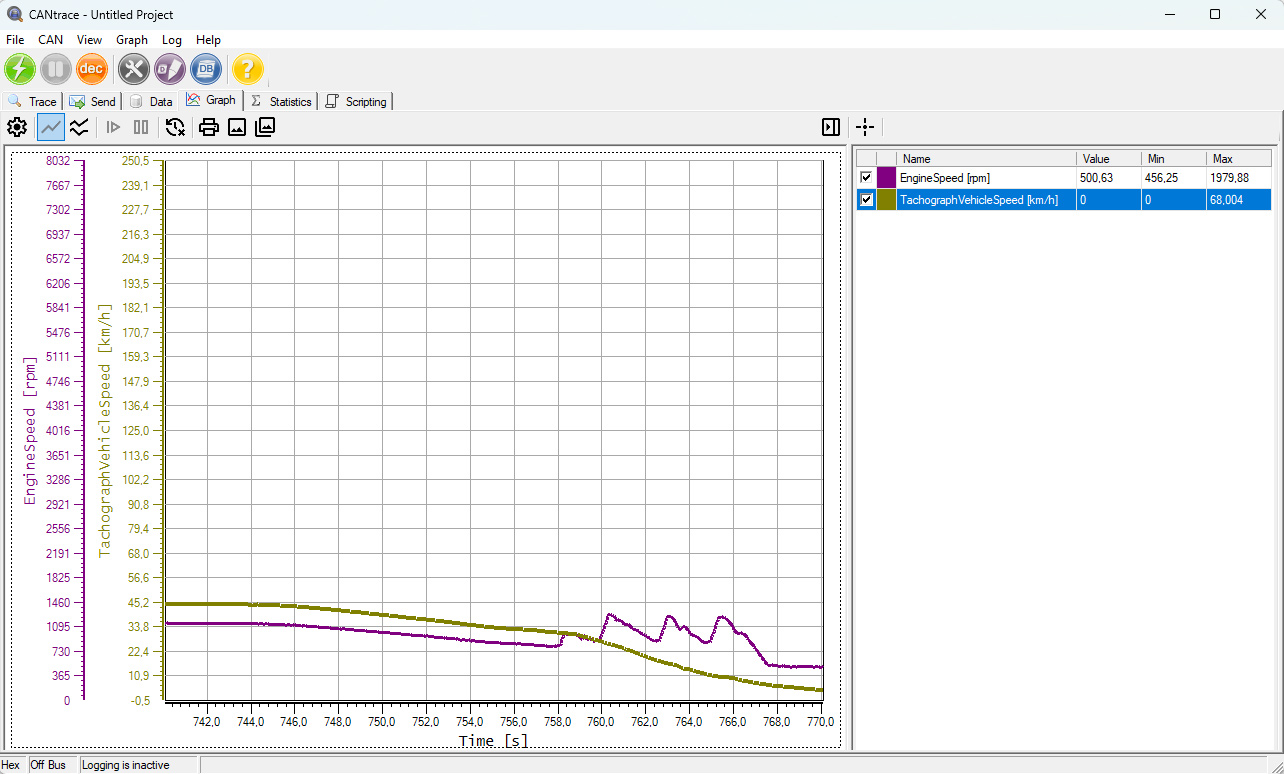
The data is from the J1939 demo log file, which was logged from the OBD-II port of a heavy truck during a development project we did some time ago. The data shows the truck slowing down to turn onto a smaller side road, you can see the RPM zig-zag in the end as the automatic gearbox is shifting down.
To use a database to decode signals you need to start by associating a database (DBC) file with a CAN channel. This is done through the File→Associate Database menu.
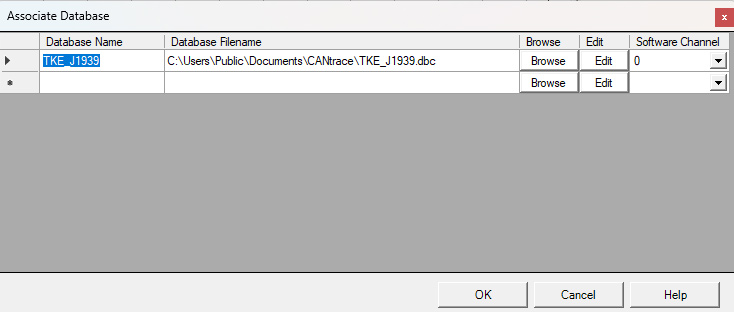
Click Browse to select the DBC file, and remember to select the correct Software Channel. Channel 0 is for log playback, and Channel 1 is where you have your first real CAN interface
As soon as the database is associated with the right software channel the signals will show up in the Trace View, but only if Trace→Fixed View is enabled.
In fixed view a “+” (plus) sign will be visible in front of the CAN message, if the CAN message has a definition in the database file. Clicking the plus sign will open the signal list for that CAN message.
In the graph view you have to add the signals you want to view by right-clicking the graph and selecting Configure Signals… from the context menu.
In the Configure Signals dialogue you select “Add…”, which opens up another dialogue where you can browse the database file for available signals. Select the signals you want to view in the graph and click “Add” for every signal you want to include in the graph.
If you include more than 8 signals, Y-axis in single view for further signals added will be automatically disabled. They can be enabled by selecting the signals in the Configure Signals window and checking the check-box “Y-axis Visible” under the Single Graph view settings.
With the signals added to the graph you can go on bus and the data will show up in the graph
Sometimes you can get the DBC file directly from the manufacturer of the vehicle you are debugging. Other times you can get it from your own R&D department. Sometimes you need to make the DBC file yourself.
CANtrace includes a Database Editor from Kvaser, which can be accessed from the File→Database Editor.. menu.
Using this editor you can create a DBC file for your own custom application.
After you have configured the CAN hardware in CAN->Settings… window, you can enable/disable logging in CANtrace. If you want to enable logging, follow the below guide.
Existing log files in Vector ASCII (ASC) log file format can be played back in CANtrace, either internally or to CAN bus.
When played back internally, the messages from the log file show up in the trace, data and graph view as if they were coming from a real CAN bus. If normal internal playback is selected (Determined by the Log File), no data will be transmitted to or received from the CAN bus. If internal playback (0 – Display Only) is selected, no data will be transmitted to the CAN bus.
When played back to the bus, the messages from the log file are transmitted to the CAN bus on the selected channel.
Below, we describe how to setup normal internal playback.
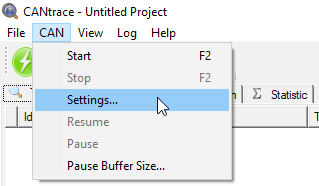
The CAN Interfaces Settings dialogue used to configure the playback can be found from the menu CAN → Settings…
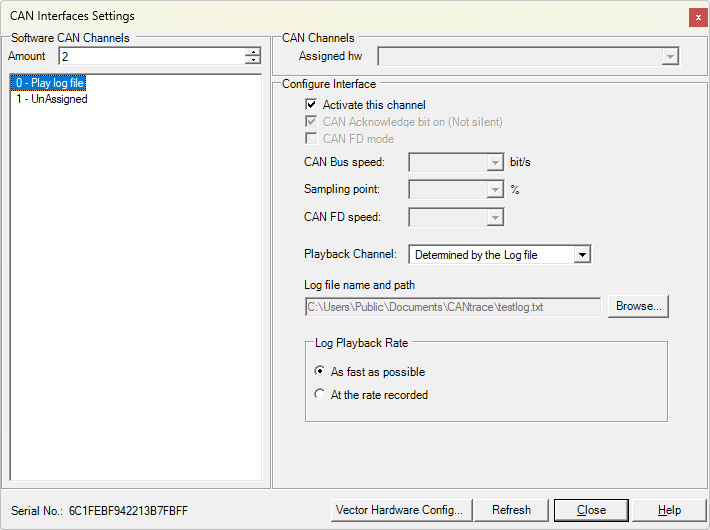
0 Play log file
Select this software channel to play back an existing log file.
Activate this channel
Select the Activate this channel checkbox to activate the playback.
Playback ChannelB
By default, Determined by the Log File is selected. This option displays the log in the trace, data, and graph windows.
Log file name and path
Click the Browse… button to browse to and select the log file to play back. The file selection dialogue by default only shows files that have a compatible file extension (ASC and TXT), but the filter setting can be changed to show all files. The selected filter setting is saved when opening a log
file, and applied when the dialogue is opened the next time.
Log Playback Rate
By default, the As fast as possible radio button is selected. This means that the messages in the log file are played back at the maximum possible rate. Selecting the At the rate recorded radio button will play back the messages at the same rate that they were recorded.
After the desired configuration has been applied, click Close to close the CAN-Interfaces Settings dialogue. Go on bus to play back the log. CANtrace will automatically go off bus when the playback has finished.
Please go to Control Panel→ Programs→ Uninstall a program and uninstall CANtrace.
For support, contact TK Engineering, support email support@tke.fi. Please include the following information: